קובץ:2018-Opioid-Deaths-By-Type-US-He.png

גודל התצוגה המקדימה הזאת: 800 × 487 פיקסלים. רזולוציות אחרות: 320 × 195 פיקסלים | 640 × 390 פיקסלים | 1,150 × 700 פיקסלים.
לקובץ המקורי (1,150 × 700 פיקסלים, גודל הקובץ: 69 ק"ב, סוג MIME: image/png)
| זהו קובץ שמקורו במיזם ויקישיתוף. תיאורו בדף תיאור הקובץ המקורי (בעברית) מוצג למטה. |
תקציר
| תיאור |
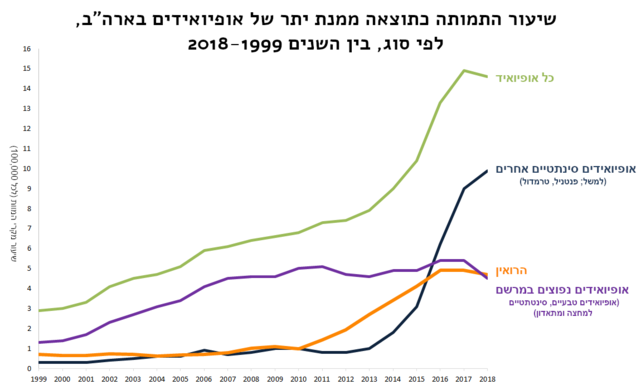
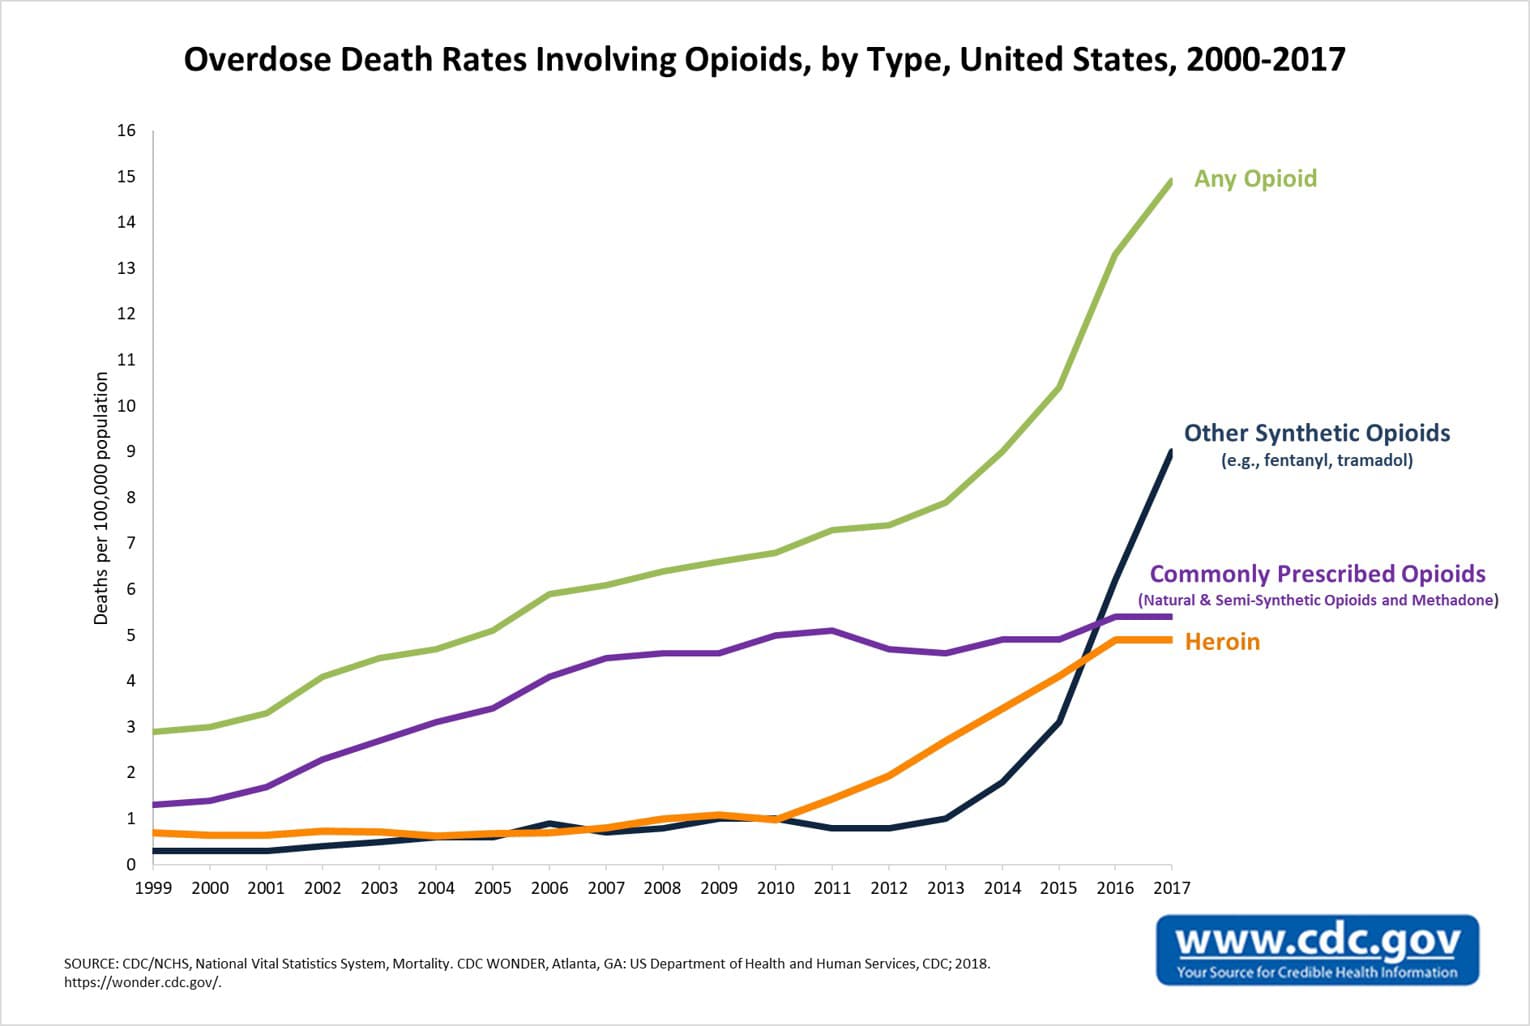
English: Timeline graph of overdose deaths involving opioids, United States. Deaths per 100,000 population. |
|||
| תאריך יצירה | - Date the chart was first uploaded to the Commons. See file history for dates of later uploads. | |||
| מקור | 2000-2017 chart. From Opioid Data Analysis and Resources. Drug Overdose. CDC Injury Center. Click on "Rising Rates" tab. See also: 2000-2016 chart. | |||
| יוצר | Centers for Disease Control and Prevention. Original chart was cropped by User:Timeshifter. Freeware IrfanView was used. | |||
| אישורים והיתרים (שימוש חוזר בקובץ זה) |
|
|||
| גרסאות אחרות |
See: |
רישיון
הקובץ הזה מתפרסם לפי תנאי רישיון קריאייטיב קומונז ייחוס-שיתוף זהה 4.0 בין־לאומי.
- הנכם רשאים:
- לשתף – להעתיק, להפיץ ולהעביר את העבודה
- לערבב בין עבודות – להתאים את העבודה
- תחת התנאים הבאים:
- ייחוס – יש לתת ייחוס הולם, לתת קישור לרישיון, ולציין אם נעשו שינויים. אפשר לעשות את זה בכל צורה סבירה, אבל לא בשום צורה שמשתמע ממנה שמעניק הרישיון תומך בך או בשימוש שלך.
- שיתוף זהה – אם תיצרו רמיקס, תשנו, או תבנו על החומר, חובה עליכם להפיץ את התרומות שלך לפי תנאי רישיון זהה או תואם למקור.
היסטוריית הקובץ
ניתן ללחוץ על תאריך/שעה כדי לראות את הקובץ כפי שנראה באותו זמן.
| תאריך/שעה | תמונה ממוזערת | ממדים | משתמש | הערה | |
|---|---|---|---|---|---|
| נוכחית | 17:22, 18 בפברואר 2021 | | 700 × 1,150 (69 ק"ב) | Matankic | m |
| 17:17, 18 בפברואר 2021 |  | 803 × 1,208 (71 ק"ב) | Matankic | =={{int:filedesc}}== {{Information |description={{en|1=Timeline graph of overdose deaths involving opioids, United States. Deaths per 100,000 population.}} |date=2021-02-18 - Date the chart was first uploaded to the Commons. See file history for dates of later uploads. |source=[https://www.cdc.gov/drugoverdose/images/data/OpioidDeathsByTypeUS.PNG 2000-2017 chart]. From [https://www.cdc.gov/drugoverdose/data/analysis.html Opioid Data Analysis and Resources. Drug Overdose.... |
שימוש בקובץ
הדפים הבאים משתמשים בקובץ הזה: