קובץ:Amfm3-en-de.gif
אין גרסה ברזולוציה גבוהה יותר.
Amfm3-en-de.gif (256 × 200 פיקסלים, גודל הקובץ: 285 ק"ב, סוג MIME: image/gif, בלולאה, 32 תמונות, 3.2 שניות)
| זהו קובץ שמקורו במיזם ויקישיתוף. תיאורו בדף תיאור הקובץ המקורי (בעברית) מוצג למטה. |
תקציר
| תיאור |
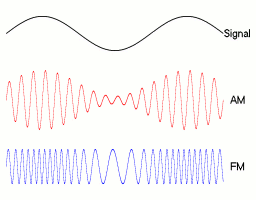
English: Animated diagram illustrating the difference between radio waves modulated by amplitude modulation and by frequency modulation. The vertical axis represents the amplitude (voltage or current) of the signals and the horizontal axis represents time. The top graph, labeled "Signal" is the modulation signal applied to the transmitter, in this simple example a sinusoidal wave. For example it could be an audio signal from a microphone. The middle graph (red) labeled "AM", is the output of an amplitude modulated radio transmitter. The magnitude (voltage or current) of the sinusoidal carrier wave varies with the modulation. The bottom graph (blue) labeled "FM", is the output of an frequency modulated (FM) radio transmitter. The frequency of the carrier wave varies with the modulation.
Español: Imagen animada en la que se muestra la diferencia entre la amplitud modulada y la frecuencia modulada.
Français : Image animée montrant la différence entre un signal modulé en amplitude et un signal modulé en fréquence.
Italiano: Grafico animato che rappresenta l'effetto della modulazione di un segnale sinusoidale trasmesso contemporaneamente su onde modulate secondo l'ampiezza (AM) e secondo la frequenza (FM).
Português: Imagem animada em que mostra-se a principal diferença entre a amplitude modulada e a freqüência modulada.
Deutsch: Animiertes Diagramm, illustriert den Unterschied zwischen Frequenzmodulation (FM) und Amplitudenmodulation (AM).
فارسی: نمودار متحرک تفاوت بین امواج رادیویی که به وسیله دامنه و فرکانس مدوله می شود را نمایش می دهد. |
| תאריך יצירה | |
| מקור | נוצר על־ידי מעלה היצירה |
| יוצר | Berserkerus |
| אישורים והיתרים (שימוש חוזר בקובץ זה) |
אני, בעל זכויות היוצרים על עבודה זו, מפרסם בזאת את העבודה תחת הרישיון הבא: הקובץ הזה מתפרסם לפי תנאי רישיון קריאייטיב קומונז ייחוס-שיתוף זהה 2.5 כללי.
|
היסטוריית הקובץ
ניתן ללחוץ על תאריך/שעה כדי לראות את הקובץ כפי שנראה באותו זמן.
| תאריך/שעה | תמונה ממוזערת | ממדים | משתמש | הערה | |
|---|---|---|---|---|---|
| נוכחית | 06:15, 7 בדצמבר 2008 | | 200 × 256 (285 ק"ב) | Esurnir~commonswiki | {{Information |Description= |Source= |Date= |Author= |Permission= |other_versions= }} |
| 15:45, 9 בנובמבר 2008 |  | 200 × 256 (84 ק"ב) | Berserkerus | {{Information |Description= |Source= |Date= |Author= |Permission= |other_versions= }} | |
| 16:04, 26 באוקטובר 2008 |  | 700 × 1,000 (507 ק"ב) | Berserkerus | {{Information |Description= {{en|Animated diagram representing the difference between radio waves modulated by amplitude and by frequency.}} {{es|Imagen animada en la que se muestra la diferencia entre la amplitud modulada y la frecuencia modulada.}} {{fr |
שימוש בקובץ
הדפים הבאים משתמשים בקובץ הזה:
שימוש גלובלי בקובץ
אתרי הוויקי השונים הבאים משתמשים בקובץ זה:
- שימוש באתר als.wikipedia.org
- שימוש באתר am.wikipedia.org
- שימוש באתר ar.wikipedia.org
- שימוש באתר awa.wikipedia.org
- שימוש באתר az.wikipedia.org
- שימוש באתר beta.wikiversity.org
- שימוש באתר be.wikipedia.org
- שימוש באתר bg.wikipedia.org
- שימוש באתר bn.wikipedia.org
- שימוש באתר ca.wikipedia.org
- שימוש באתר cs.wikipedia.org
- שימוש באתר da.wikipedia.org
- שימוש באתר de.wikipedia.org
- שימוש באתר de.wiktionary.org
- שימוש באתר el.wikipedia.org
- שימוש באתר en.wikipedia.org