קובץ:Estimations of Human Brain Emulation Required Performance.svg

גודל התצוגה המקדימה הזאת מסוג PNG של קובץ ה־SVG הזה: 800 × 600 פיקסלים. רזולוציות אחרות: 320 × 240 פיקסלים | 640 × 480 פיקסלים | 1,024 × 768 פיקסלים | 1,280 × 960 פיקסלים | 2,560 × 1,920 פיקסלים.
לקובץ המקורי (קובץ SVG, הגודל המקורי: 800 × 600 פיקסלים, גודל הקובץ: 49 ק"ב)
| זהו קובץ שמקורו במיזם ויקישיתוף. תיאורו בדף תיאור הקובץ המקורי (בעברית) מוצג למטה. |
תקציר
| תיאור |
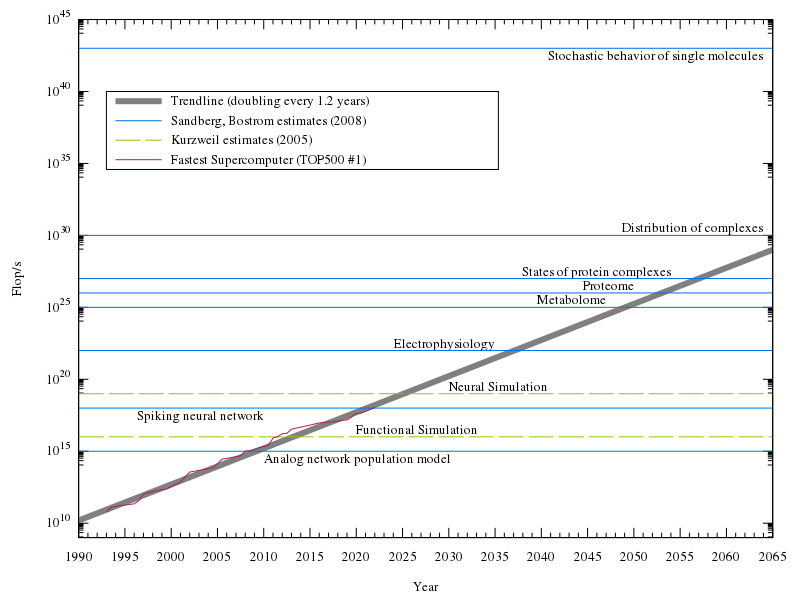
English: Estimates of how much processing power is needed to emulate a human brain at various levels, along with the fastest supercomputer from TOP500 mapped by year, and a trendline. Exponential plot, with assumption of doubling of computational power every 1.1 years for the trendline. |
| תאריך יצירה | |
| מקור | נוצר על־ידי מעלה היצירה, data from [1], PPTSuperComputersPRINT.jpg, and [2]. |
| יוצר | Tga.D |
| SVGהתפתחות | 5.2 Gnuplot עם נוצרה ה גרפיקה וקטורית |
| קוד מקור | Gnuplot codeset terminal svg size 800 600 fname "Times,13"
set output "Estimations of Human Brain Emulation Required Performance.svg"
set notitle
set key reverse Left left at 1993, 10**40 noautotitles box # good chunk of whitespace to put the key in
set datafile separator ","
set logscale y # use a logarithmic scale, for easier visualization of exponential growth
set format y "10^{%T}"
set yrange[10**9:10**45]
set ylabel "Flop/s"
set xrange [1990:2065]
set xlabel "Year"
set xtics 1990,5,2065
set mxtics 5
#set grid # I think it looks better without, but it's a matter of preference
# labels for each of the levels of emulation
set label "Analog network population model" at 2010, 10**14.5 left
set label "Spiking neural network" at 2010, 10**17.5 right
set label "Electrophysiology" at 2035, 10**22.5 right
set label "Metabolome" at 2047, 10**25.5 right
set label "Proteome" at 2050, 10**26.5 right
set label "States of protein complexes" at 2054, 10**27.5 right
set label "Distribution of complexes" at 2064, 10**30.5 right
set label "Stochastic behavior of single molecules" at 2064, 10**42.5 right
set label "Functional Simulation" at 2020, 10**16.5 left
set label "Neural Simulation" at 2030, 10**19.5 left
# best-fit is as of June 2022 list, to two sigfigs
# horizontal lines plotted to represent levels of emulation
# plot of historical TOP500 #1's stored in a .csv
# colors and sizes picked from what I thought was easiest to see
# titles done for one of each type of line, for the key
plot 87000000000.0*(2**((x-1993)/1.2)) lw 6 lc 0 w lines title "Trendline (doubling every 1.2 years)",\
10**15 ls 3 lt rgb "#0073E6", \
10**18 ls 3 lt rgb "#0073E6", \
10**22 ls 3 lt rgb "#0073E6", \
10**25 ls 3 lt rgb "#0073E6", \
10**26 ls 3 lt rgb "#0073E6", \
10**27 ls 3 lt rgb "#0073E6", \
10**30 ls 3 lt rgb "#0073E6", \
10**43 ls 3 lt rgb "#0073E6" title "Sandberg, Bostrom estimates (2008)",\
10**16 ls 2 dt (50,10) lc rgb "#89CE00", \
10**19 ls 2 dt (50,10) lt rgb "#89CE00" title "Kurzweil estimates (2005)",\
"TOP500.csv" using 1:2 ls 1 lt rgb "#B51963" pt 7 ps .5 with linespoints title "Fastest Supercomputer (TOP500 #1)"
DataThe #1 computer over the years from TOP500, used to generate the supercomputer line at the end of the Gnuplot code. The name of each supercomputer is in the file, but unused in the code/chart. Whole number years represent a June list, .5 represents a November list.
Year,Flop/s,Name
1993,59700000000,CM-5/1024
1993.5,124000000000,Numerical Wind Tunnel
1994,143400000000,XP/S140
1994.5,170000000000,Numerical Wind Tunnel
1996,220400000000,SR2201/1024
1996.5,368200000000,CP-PACS/2048
1997,1068000000000,ASCI Red
1997.5,1338000000000,ASCI Red
1999,2121000000000,ASCI Red
1999.5,2379000000000,ASCI Red
2000.5,4938000000000,ASCI White
2001,7226000000000,ASCI White
2002,35860000000000,Earth-Simulator
2004.5,70720000000000,BlueGene/L beta-System
2005,136800000000000,BlueGene/L
2005.5,280600000000000,BlueGene/L
2007.5,478200000000000,BlueGene/L
2008,1026000000000000,Roadrunner
2008.5,1105000000000000,Roadrunner
2009.5,1759000000000000,Jaguar
2010.5,2566000000000000,Tianhe-1A
2011,8162000000000000,K computer
2011.5,10510000000000000,K computer
2012,16324800000000000,Sequoia
2012.5,17590000000000000,Titan
2013,33862700000000000,Tianhe-2A
2016,93014600000000000,Sunway TaihuLight
2018,122300000000000000,Summit
2018.5,143500000000000000,Summit
2020,415530000000000000,Fugaku
2020.5,442000000000000000,Fugaku
2022,1102000000000000000,Frontier
|
רישיון
אני, בעל זכויות היוצרים על עבודה זו, מפרסם בזאת את העבודה תחת הרישיון הבא:
הקובץ הזה מתפרסם לפי תנאי רישיון קריאייטיב קומונז ייחוס-שיתוף זהה 3.0 לא מותאם.
- הנכם רשאים:
- לשתף – להעתיק, להפיץ ולהעביר את העבודה
- לערבב בין עבודות – להתאים את העבודה
- תחת התנאים הבאים:
- ייחוס – יש לתת ייחוס הולם, לתת קישור לרישיון, ולציין אם נעשו שינויים. אפשר לעשות את זה בכל צורה סבירה, אבל לא בשום צורה שמשתמע ממנה שמעניק הרישיון תומך בך או בשימוש שלך.
- שיתוף זהה – אם תיצרו רמיקס, תשנו, או תבנו על החומר, חובה עליכם להפיץ את התרומות שלך לפי תנאי רישיון זהה או תואם למקור.
היסטוריית הקובץ
ניתן ללחוץ על תאריך/שעה כדי לראות את הקובץ כפי שנראה באותו זמן.
| תאריך/שעה | תמונה ממוזערת | ממדים | משתמש | הערה | |
|---|---|---|---|---|---|
| נוכחית | 03:40, 22 בפברואר 2023 | | 600 × 800 (49 ק"ב) | Tga.D | updated data, fixed colors and styles to be more color blind-friendly |
| 19:11, 7 במרץ 2022 |  | 600 × 800 (37 ק"ב) | Daemon2010 | Added Fugaku | |
| 09:32, 20 בפברואר 2019 |  | 600 × 800 (45 ק"ב) | Tga.D | Increase font size; adjust label positions | |
| 09:15, 20 בפברואר 2019 |  | 600 × 800 (45 ק"ב) | Tga.D | Regenerated with a newer version of gnuplot, and more recent TOP500 data. Opted to not update the trendline, as the divergence from expected seems more relevant. | |
| 01:20, 19 ביוני 2013 |  | 600 × 800 (34 ק"ב) | Tga.D | New #1 on the TOP 500 June 2013 list. | |
| 04:07, 24 בדצמבר 2012 |  | 600 × 800 (34 ק"ב) | Tga.D | large mediawiki-generated png versions had messed up spacing in the key, switching the order to see if it fixes it | |
| 03:29, 24 בדצמבר 2012 |  | 600 × 800 (34 ק"ב) | Tga.D | User created page with UploadWizard |
שימוש בקובץ
הדף הבא משתמש בקובץ הזה:
שימוש גלובלי בקובץ
אתרי הוויקי השונים הבאים משתמשים בקובץ זה:
- שימוש באתר ar.wikipedia.org
- שימוש באתר bs.wikipedia.org
- שימוש באתר ca.wikipedia.org
- שימוש באתר en.wikipedia.org
- שימוש באתר es.wikipedia.org
- שימוש באתר fa.wikipedia.org
- שימוש באתר fr.wikipedia.org
- שימוש באתר gl.wikipedia.org
- שימוש באתר hu.wikipedia.org
- שימוש באתר id.wikipedia.org
- שימוש באתר ja.wikipedia.org
- שימוש באתר ru.wikipedia.org
- שימוש באתר th.wikipedia.org
- שימוש באתר uk.wikipedia.org
- שימוש באתר zh.wikipedia.org