קובץ:Hilbert transform.png
לקובץ המקורי (1,600 × 1,120 פיקסלים, גודל הקובץ: 120 ק"ב, סוג MIME: image/png)
| זהו קובץ שמקורו במיזם ויקישיתוף. תיאורו בדף תיאור הקובץ המקורי (בעברית) מוצג למטה. |
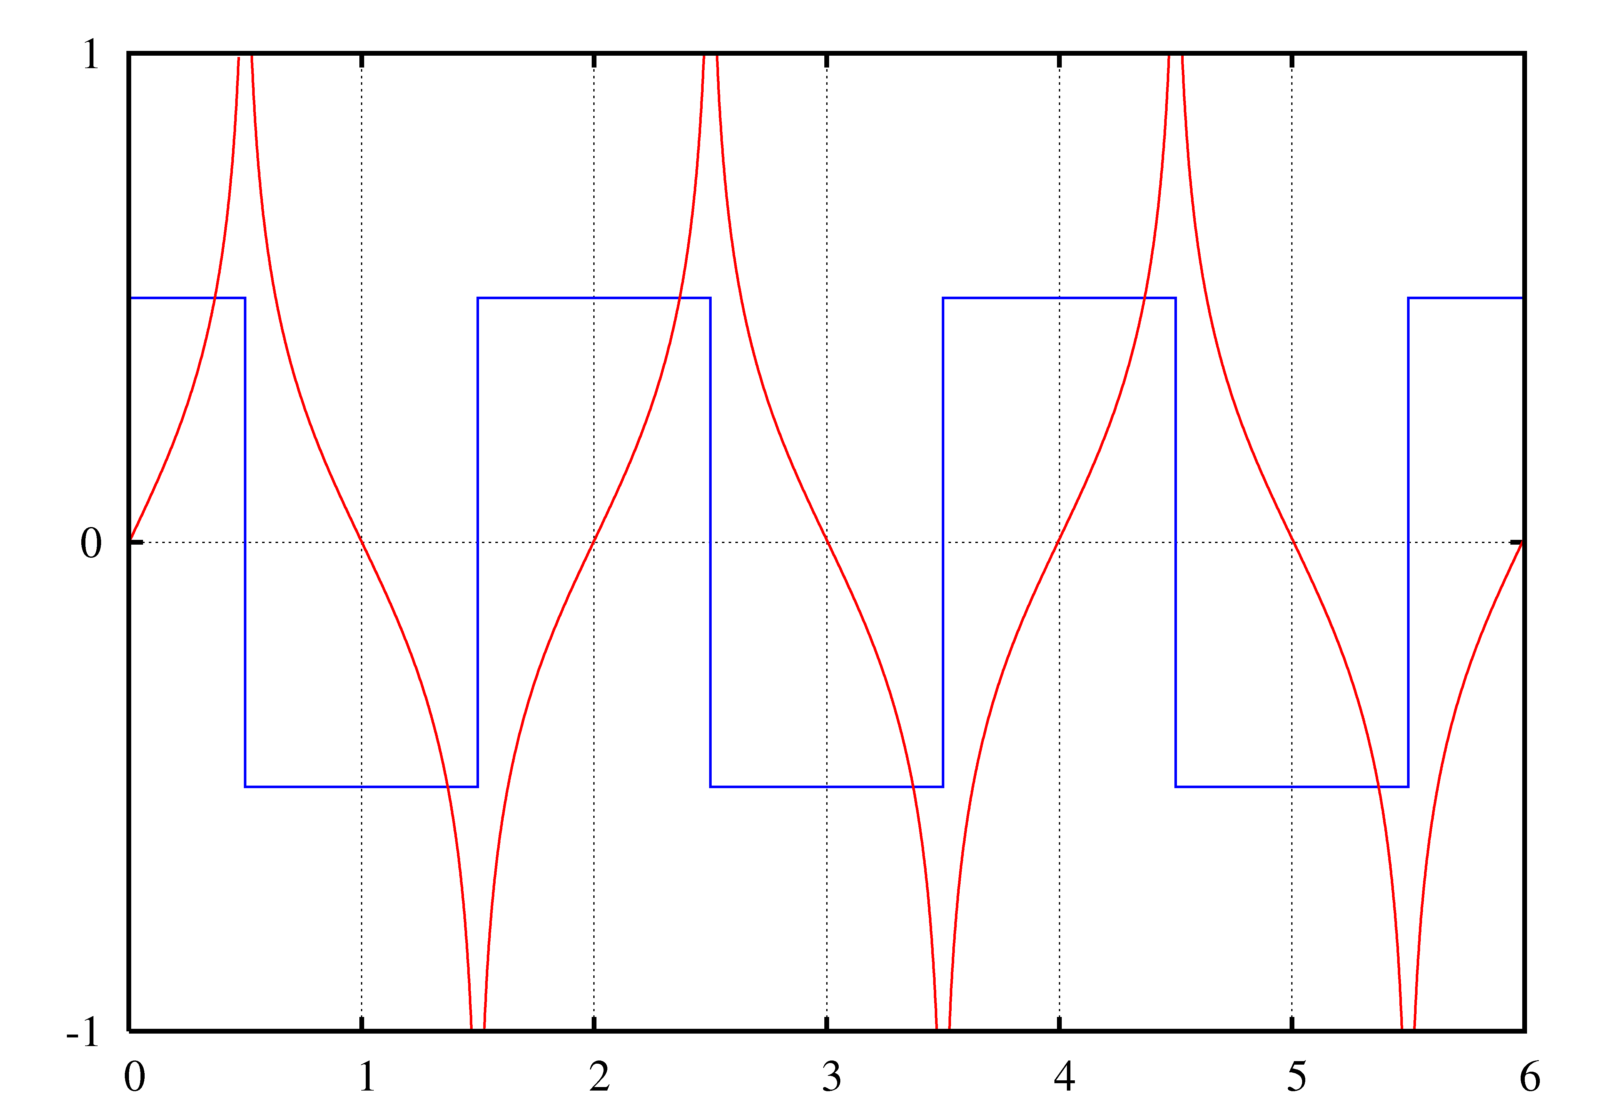
A graph of the Hilbert transform (red) of a square wave (blue).

|
קיימת תמונה חדשה תמונה זו בגרסה וקטורית בפורמט "SVG". יש להחליף את התמונה הנוכחית בתמונה החדשה.
File:Hilbert transform.png → File:Hilbert transform.svg
למידע נוסף אודות גרפיקה וקטורית, אנא קראו אודות המעבר של ויקישיתוף לתמונות בפורמט SVG. ראו גם מידע אודות התמידה של מדיה-ויקי בתמונות בפורמט SVG. |
 |
Instructions
See Wikipedia graph-making tips.
Plotted in Maxima with the following commands:
u(t) := 1/2*(1+signum(t));
rect(t) := u(t + 1/2) - u(t - 1/2);
A train of rectangular pulses (or a square wave). This should be n=−∞..+∞, but I can't get Maxima to evaluate it, so I just chose n values that would give a close enough approximation for the visible area:
train(t) := sum(rect(t-2*n),n,-10,20);
The Hilbert transform of a rectangular pulse:
hrect(t) := log(abs((t+1/2)/(t-1/2)))/%PI;
A "train" of hrects. Again with the approximation, though this time it actually matters (rectangular function is 0 everywhere; this is not.):
htrain(t) := sum(hrect(t-2*n),n,-100,100);
The plot command:
plot2d([train(t)-0.5,htrain(t)],[t,0,6],[y,-1,1],[nticks,500], [gnuplot_preamble,"set grid; set ytics 1; set nokey"], [gnuplot_ps_term_command,"set term postscript enhanced landscape color solid lw 2 'Times-Roman' 20"], [gnuplot_term,ps], [gnuplot_out_file,"hilbert.ps"]);
This causes gnuplot to create a .ps file.
To convert the PostScript file to PNG:
- Open it in the GIMP (make sure you have ghostscript installed! - Windows instructions)
- Enter 500 under Resolution (it doesn't say "DPI" but I think that's what it means)
- Uncheck Try bounding box (since the bounding box cuts off the edge, unfortunately. You can try with the bounding box first.)
- Enter large values for Width and Height
- Check Color
- Check Strong anti-aliasing for both graphics and text
- Crop off extra whitespace (Shift+C if you can't find it in the toolbox)
- Possibly need to rotate it: Click Image → Transform → Rotate 90 degrees clockwise
Filters → Blur → Gaussian blur at 2.0 px(No need to blur if you use strong anti-aliasing during conversion. I see no significant difference between end results.)- Image → Scale Image...
- Width and Height at 25%
- Cubic interpolation
- You can view at normal size if you want by pressing 1, Ctrl+E
- Save as Hilbert transform.png
Original version of this plot was made in GNU Octave with the command:
imag(hilbert(x))
Created by User:Omegatron using gnuplot, possibly with post-processing in the GIMP (PNG) or Inkscape (SVG)
- הנכם רשאים:
- לשתף – להעתיק, להפיץ ולהעביר את העבודה
- לערבב בין עבודות – להתאים את העבודה
- תחת התנאים הבאים:
- ייחוס – יש לתת ייחוס הולם, לתת קישור לרישיון, ולציין אם נעשו שינויים. אפשר לעשות את זה בכל צורה סבירה, אבל לא בשום צורה שמשתמע ממנה שמעניק הרישיון תומך בך או בשימוש שלך.
- שיתוף זהה – אם תיצרו רמיקס, תשנו, או תבנו על החומר, חובה עליכם להפיץ את התרומות שלך לפי תנאי רישיון זהה או תואם למקור.

|
מוענקת בכך הרשות להעתיק, להפיץ או לשנות את המסמך הזה, לפי תנאי הרישיון לשימוש חופשי במסמכים של גנו, גרסה 1.2 או כל גרסה מאוחרת יותר שתפורסם על־ידי המוסד לתוכנה חופשית; ללא פרקים קבועים, ללא טקסט עטיפה קדמית וללא טקסט עטיפה אחורית. עותק של הרישיון כלול בפרק שכותרתו הרישיון לשימוש חופשי במסמכים של גנו. |
(In short, this means that you can copy and modify the image freely as long as you provide attribution; preferably in the form of a link back to this page.)
היסטוריית הקובץ
ניתן ללחוץ על תאריך/שעה כדי לראות את הקובץ כפי שנראה באותו זמן.
| תאריך/שעה | תמונה ממוזערת | ממדים | משתמש | הערה | |
|---|---|---|---|---|---|
| נוכחית | 21:54, 2 ביולי 2005 | | 1,120 × 1,600 (120 ק"ב) | Omegatron | Image of the Hilbert transform of a square wave. |
| 22:53, 26 ביוני 2005 |  | 433 × 608 (5 ק"ב) | Omegatron | A graph or diagram made by User:Omegatron. (Uploaded with Wikimedia Commons.) Source: Created by User:Omegatron {{GFDL}}{{cc-by-sa-2.0}} Category:Diagrams\ |
שימוש בקובץ
![]() אין בוויקיפדיה דפים המשתמשים בקובץ זה.
אין בוויקיפדיה דפים המשתמשים בקובץ זה.
שימוש גלובלי בקובץ
אתרי הוויקי השונים הבאים משתמשים בקובץ זה:
- שימוש באתר ar.wikipedia.org
- שימוש באתר ca.wikipedia.org
- שימוש באתר es.wikipedia.org
- שימוש באתר fa.wikipedia.org
- שימוש באתר fr.wikipedia.org
- שימוש באתר zh.wikipedia.org