Tautochrone_curve.gif(300 × 200 פיקסלים, גודל הקובץ: 102 ק"ב, סוג MIME‏: image/gif, בלולאה, 80 תמונות, 3.2 שניות)

ויקישיתוף זהו קובץ שמקורו במיזם ויקישיתוף. תיאורו בדף תיאור הקובץ המקורי (בעברית) מוצג למטה.

תקציר

תיאור

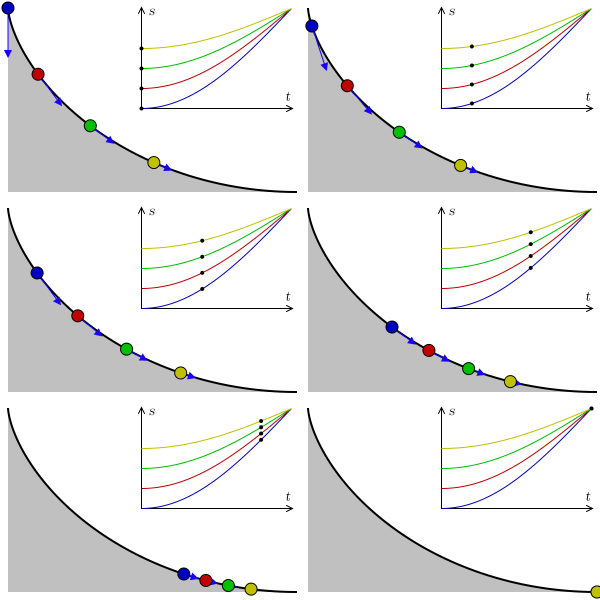
A tautochrone curve is the curve for which the time taken by an object sliding without friction in uniform gravity to its lowest point is independent of its starting point. Here, four points at different positions reach the bottom at the same time.


In the graphic, s represents arc length, t represents time, and the blue arrows represent acceleration along the trajectory. As the points reach the horizontal, the velocity becomes constant, the arc length being linear to time.
תאריך יצירה ‏9 במאי 2007‏; new version ‏אוגוסט 2009‏
מקור נוצר על־ידי מעלה היצירה
יוצר

Claudio Rocchini

rewritten by Geek3
GIFהתפתחות 
InfoField
 
Matplotlib עם‎‎ נוצרה ה GIF תמונת מפת סיביות
קוד מקור
InfoField

Python code

#!/usr/bin/python
# -*- coding: utf8 -*-

'''
animation of balls on a tautochrone curve
'''

import os
import numpy as np
import matplotlib.pyplot as plt
import matplotlib.patches as patches
from matplotlib import animation
from math import *

# settings
fname = 'Tautochrone curve'
width, height = 300, 200
nframes = 80
fps=25

balls = [
{'a':1.0, 'color':'#0000c0'},
{'a':0.8, 'color':'#c00000'},
{'a':0.6, 'color':'#00c000'},
{'a':0.4, 'color':'#c0c000'}]

def curve(phi):
    x = phi + sin(phi)
    y = 1.0 - cos(phi)
    return np.array([x, y])

def animate(nframe, empty=False):
    t = nframe / float(nframes - 1.)
    
    # prepare a clean and image-filling canvas for each frame
    fig = plt.gcf()
    fig.clf()
    ax_canvas = plt.gca()
    ax_canvas.set_position((0, 0, 1, 1))
    ax_canvas.set_xlim(0, width)
    ax_canvas.set_ylim(0, height)
    ax_canvas.axis('off')
    
    # draw the ramp
    x0, y0 = 293, 8
    h = 182
    npoints = 200
    points = []
    for i in range(npoints):
        phi = i / (npoints - 1.0) * pi - pi
        x, y = h/2. * curve(phi) + np.array([x0, y0])
        points.append([x, y])
    
    rampline = patches.Polygon(points, closed=False, facecolor='none',
                       edgecolor='black', linewidth=1.5, capstyle='butt')
    points += [[x0-h*pi/2, y0], [x0-h*pi/2, y0+h]]
    
    ramp = patches.Polygon(points, closed=True, facecolor='#c0c0c0', edgecolor='none')
    
    # plot axes
    plotw = 0.5
    ax_plot = fig.add_axes((0.47, 0.46, plotw, plotw*2/pi*width/height))
    ax_plot.set_xlim(0, 1)
    ax_plot.set_ylim(0, 1)
    for b in balls:
        time_array = np.linspace(0, 1, 201)
        phi_pendulum_array = (1 - b['a'] * np.cos(time_array*pi/2))
        ax_plot.plot(time_array, phi_pendulum_array, '-', color=b['color'], lw=.8)
    ax_plot.set_xticks([])
    ax_plot.set_yticks([])
    ax_plot.set_xlabel('t')
    ax_plot.set_ylabel('s')
    
    ax_canvas.add_patch(ramp)
    ax_canvas.add_patch(rampline)
    
    for b in balls:
        # draw the balls
        phi_pendulum = b['a'] * -cos(t * pi/2)
        phi_wheel = 2 * asin(phi_pendulum)
        phi_wheel = -abs(phi_wheel)
        x, y = h/2. * curve(phi_wheel) + np.array([x0, y0])
        ax_canvas.add_patch(patches.Circle((x, y), radius=6., zorder=3,
                            facecolor=b['color'], edgecolor='black'))
        ax_plot.plot([t], [1 + phi_pendulum], '.', ms=6., mec='none', mfc='black')
        
        v = h/2. * np.array([1 + cos(phi_wheel), sin(phi_wheel)])
        vnorm = v / hypot(v[0], v[1])
        # in the harmonic motion, acceleration is proportional to -position
        acc_along_line = 38. * -phi_pendulum * vnorm
        ax_canvas.arrow(x, y, acc_along_line[0], acc_along_line[1],
                 head_width=6, head_length=6, fc='#1b00ff', ec='#1b00ff')

fig = plt.figure(figsize=(width/100., height/100.))
print 'saving', fname + '.gif'
#anim = animation.FuncAnimation(fig, animate, frames=nframes)
#anim.save(fname + '.gif', writer='imagemagick', fps=fps)

frames = []
for nframe in range(nframes):
    frame = fname + '_{:02}.png'.format(nframe)
    animation.FuncAnimation(fig, lambda n: animate(nframe), frames=1).save(
        frame, writer='imagemagick')
    frames.append(frame)

# assemble animation using imagemagick, this avoids dithering and huge filesize
os.system('convert -delay {} +dither +remap -layers Optimize {} "{}"'.format(
    100//fps, ' '.join(['"' + f + '"' for f in frames]), fname + '.gif'))
for frame in frames:
    if os.path.exists(frame):
        os.remove(frame)

רישיון

אני, בעל זכויות היוצרים על היצירה הזאת, מפרסם אותה בזאת תחת הרישיונות הבאים:
GNU head מוענקת בכך הרשות להעתיק, להפיץ או לשנות את המסמך הזה, לפי תנאי הרישיון לשימוש חופשי במסמכים של גנו, גרסה 1.2 או כל גרסה מאוחרת יותר שתפורסם על־ידי המוסד לתוכנה חופשית; ללא פרקים קבועים, ללא טקסט עטיפה קדמית וללא טקסט עטיפה אחורית. עותק של הרישיון כלול בפרק שכותרתו הרישיון לשימוש חופשי במסמכים של גנו.
w:he:Creative Commons
ייחוס שיתוף זהה
הקובץ הזה מתפרסם לפי תנאי רישיון קריאייטיב קומונז ייחוס-שיתוף זהה 3.0 לא מותאם.
הנכם רשאים:
  • לשתף – להעתיק, להפיץ ולהעביר את העבודה
  • לערבב בין עבודות – להתאים את העבודה
תחת התנאים הבאים:
  • ייחוס – יש לתת ייחוס הולם, לתת קישור לרישיון, ולציין אם נעשו שינויים. אפשר לעשות את זה בכל צורה סבירה, אבל לא בשום צורה שמשתמע ממנה שמעניק הרישיון תומך בך או בשימוש שלך.
  • שיתוף זהה – אם תיצרו רמיקס, תשנו, או תבנו על החומר, חובה עליכם להפיץ את התרומות שלך לפי תנאי רישיון זהה או תואם למקור.
תבנית רישוי זו הוספה לקובץ כחלק מעדכון רישיון GFDL.
w:he:Creative Commons
ייחוס
הקובץ הזה מתפרסם לפי תנאי רישיון קריאייטיב קומונז ייחוס 2.5 כללי.
הנכם רשאים:
  • לשתף – להעתיק, להפיץ ולהעביר את העבודה
  • לערבב בין עבודות – להתאים את העבודה
תחת התנאים הבאים:
  • ייחוס – יש לתת ייחוס הולם, לתת קישור לרישיון, ולציין אם נעשו שינויים. אפשר לעשות את זה בכל צורה סבירה, אבל לא בשום צורה שמשתמע ממנה שמעניק הרישיון תומך בך או בשימוש שלך.
הנכם מוזמנים לבחור את הרישיון הרצוי בעיניכם.

כיתובים

נא להוסיף משפט שמסביר מה הקובץ מייצג

פריטים שמוצגים בקובץ הזה

מוצג

היסטוריית הקובץ

ניתן ללחוץ על תאריך/שעה כדי לראות את הקובץ כפי שנראה באותו זמן.

תאריך/שעהתמונה ממוזערתממדיםמשתמשהערה
נוכחית16:15, 1 באוגוסט 2009תמונה ממוזערת לגרסה מ־16:15, 1 באוגוסט 2009‪200 × 300‬ (102 ק"ב)Geek3new physically correct version
09:56, 9 במאי 2007תמונה ממוזערת לגרסה מ־09:56, 9 במאי 2007‪200 × 300‬ (602 ק"ב)Rocchini{{Information |Description=Tautochrone curve animation (4 points runs over a cycloid) |Source=Own work |Date=2007-05-09 |Author=Claudio Rocchini |Permission=CC-BY 2.5 }}

הדף הבא משתמש בקובץ הזה:

שימוש גלובלי בקובץ

אתרי הוויקי השונים הבאים משתמשים בקובץ זה: